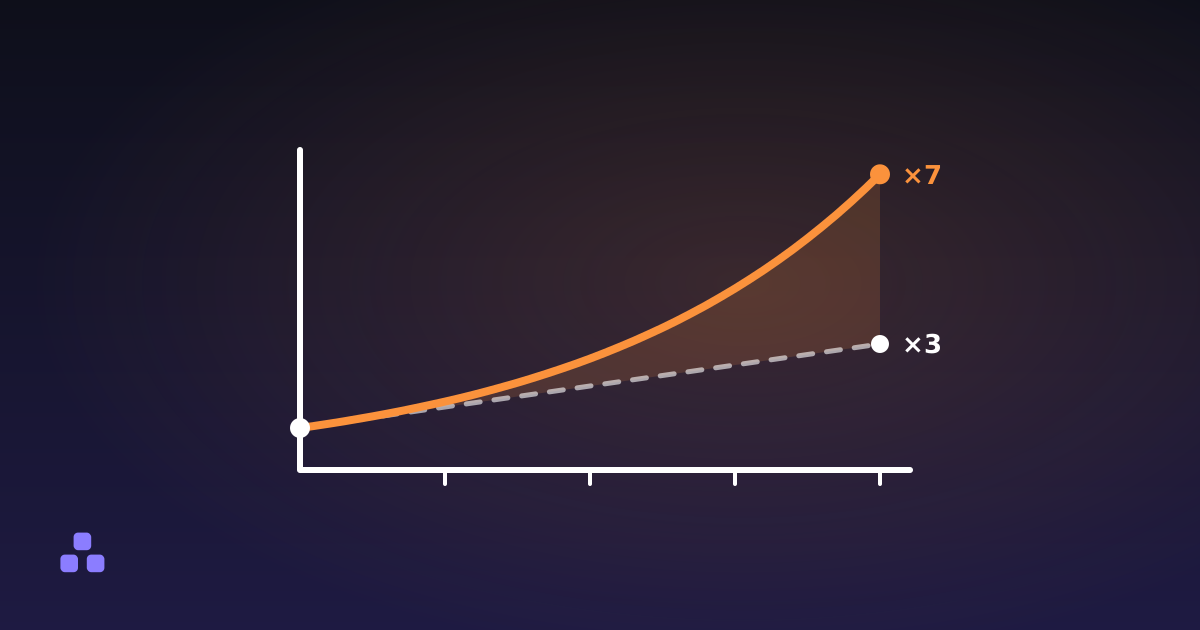
CAGR, the compound annual growth rate, is the single constant yearly rate that would take a value from where it started to where it ended over a set number of years. The formula is (end ÷ start)1/years − 1. Money that goes from $10,000 to $20,000 in 6 years has a CAGR of 21/6 − 1, which is 12.25% a year. It is a summary of two numbers, the first and the last, and it knows nothing about what happened in between.
How do you calculate CAGR?
Three steps, and only the middle one is unfamiliar.
- Divide the ending value by the starting value. That is the growth multiple: $20,000 ÷ $10,000 = 2.
- Raise it to the power of 1 divided by the number of years. Over 6 years that is 21/6 = 1.1225. On most calculators this is the
xykey with 1 ÷ 6 typed as the exponent. - Subtract 1 and read it as a percentage: 0.1225, or 12.25% a year.
The years do not have to be whole. Eighteen months is 1.5, and a value that grew 30% in that time has a CAGR of 1.31/1.5 − 1, about 19.1% a year. The one thing the formula cannot take is a start value of zero or less, because there is nothing to grow from.
This site has no CAGR calculator, and the tool that comes closest runs the formula the other way. To check your result, enter the starting amount in the compound interest calculator, set contributions to none, the rate to your CAGR, compounding to yearly and inflation to zero. After 6 years of 12.25% it lands at about $20,000, which is the figure you started from. For the other number people ask about, the total change over the whole period, the percentage change mode turns $10,000 and $20,000 into +100%.
Why is CAGR not the average of the yearly returns?
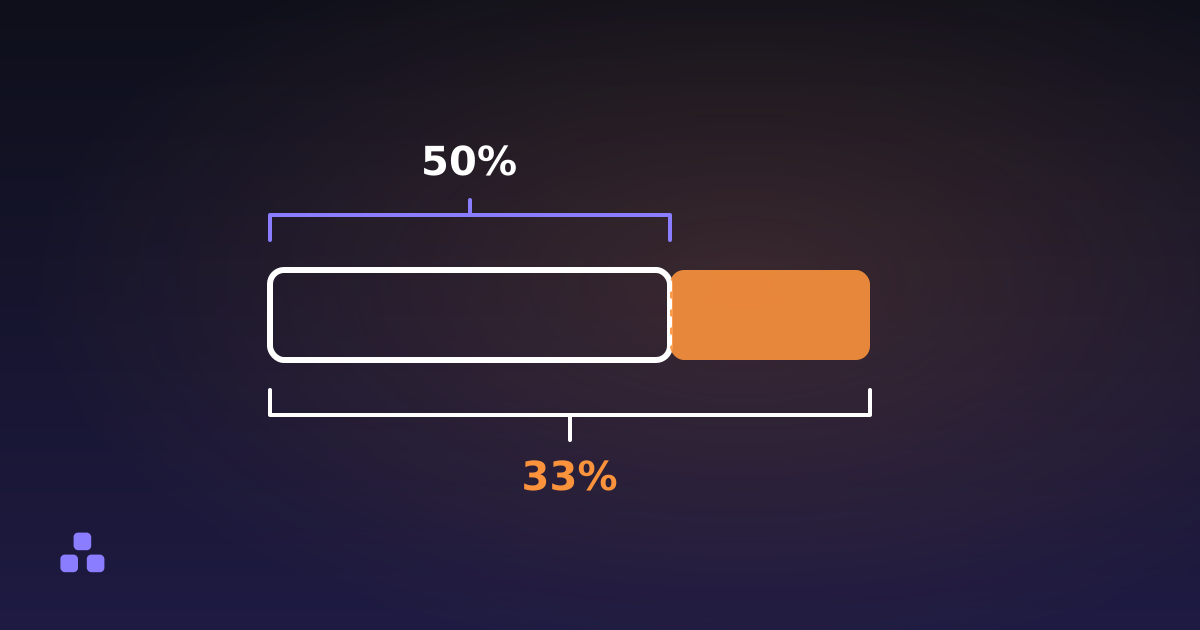
Because a percentage loss and a percentage gain of the same size do not cancel. A 50% drop needs a 100% gain to recover, and a 40% drop needs a gain of 66.7%. Yearly returns multiply; they do not add. Here are four years of returns that look fine on average:
| Year | Return | Balance at year end |
|---|---|---|
| Start | — | $10,000 |
| 1 | +50% | $15,000 |
| 2 | −40% | $9,000 |
| 3 | +30% | $11,700 |
| 4 | −20% | $9,360 |
The simple average of +50, −40, +30 and −20 is +5% a year. A steady 5% for four years would have ended at $12,155. The real balance ended at $9,360, a total change of −6.4%, and the CAGR is 0.9361/4 − 1, or −1.64% a year. The average said you gained; the money says you lost.
The average of the yearly returns, called the arithmetic mean, is never lower than the CAGR, and the gap widens as the returns get wilder. If every year were identical the two would match. That is why a fund quoting its average return instead of its CAGR looks better than it was, and why successive percentages never add up in the first place.
The order of the yearly returns does not change the CAGR. Multiplication does not care which factor comes first, so the same four returns in any order give the same $9,360. That is only true while nothing is paid in or taken out along the way, which matters in the next section.
What does CAGR hide?
Everything that happened between the two endpoints. The figure is honest as a comparison and misleading as a description, in at least five ways.
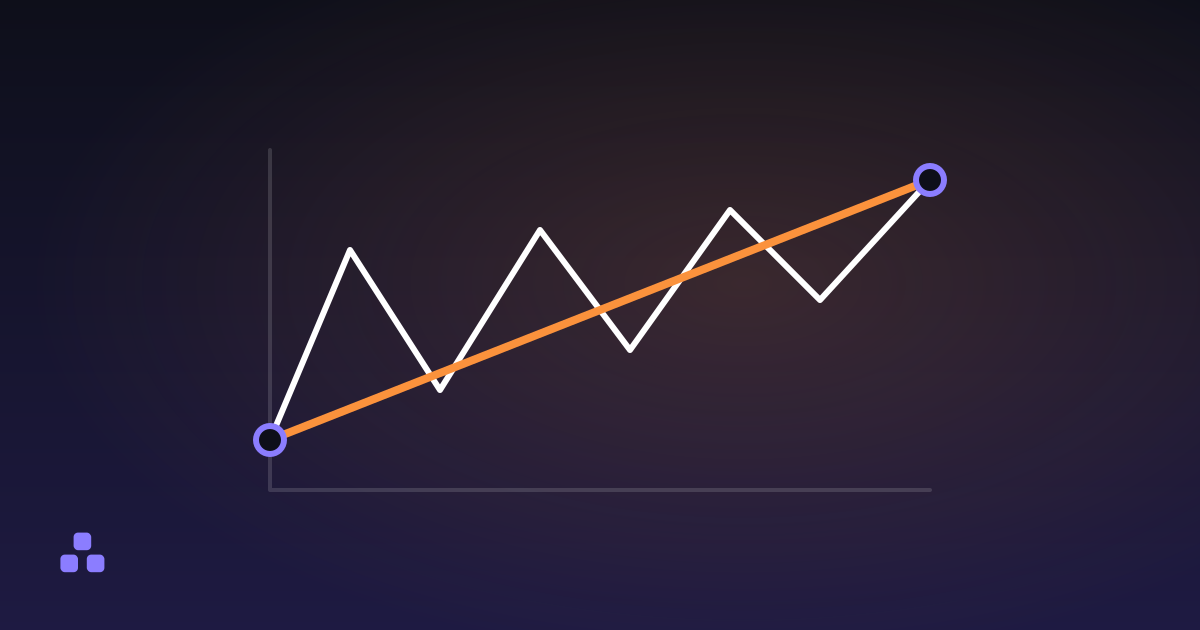
- The road. Two investments can share a CAGR of 12.25% while one rose every year and the other fell 40% along the way. CAGR draws a straight line between the endpoints. It shows nothing of how far you would have been underwater in year three, or whether you would have sold there.
- The dates you chose. Start measuring at a low point and the CAGR flatters the result; start at a peak and it punishes it. The same asset can show two very different CAGRs for periods that overlap by nine years out of ten. Whoever quotes one decided where to begin.
- Money going in or out. The formula assumes a single starting amount and nothing added or withdrawn. If you contribute every month, the money added late has had less time to grow, and a plain CAGR on the balance no longer measures your return. The right tool for that is a money-weighted return (the internal rate of return), which this site does not calculate.
- Fees, tax and inflation. CAGR is arithmetic on whatever two numbers you give it. Feed it balances before fees and it reports a return before fees. Feed it nominal money and it ignores that prices rose. Work it out on the figure you actually keep, and subtract inflation if you want buying power.
- The future. A CAGR describes a period that is over. It is not a forecast, and the next six years will not honour it. Projections that repeat a past CAGR forever inherit the weakness of a fixed-rate projection: real returns arrive in an order, and the order matters once you are paying in.
When is CAGR the right number to use?
When you are comparing two things over the same stretch of time and nothing was added or removed along the way. Revenue in 2021 against revenue in 2026, the price of a house across ten years, a savings balance with no deposits: all of those have a single start, a single end and no cash flows in the middle, which is exactly what the formula assumes.
It also turns a vague phrase into a rate. “It doubled in 6 years” sounds like a story; 12.25% a year is something you can compare with a savings account. The rule of 72 gives you the same answer in your head: 72 ÷ 12.25 is 5.9 years, close to the true 6.
Quote it with its endpoints and its period or not at all. “12.25% a year from January 2020 to January 2026, before fees” can be checked. “12.25% a year” cannot.
To see what a CAGR looks like in money, run it forward in the compound interest calculator: pick a rate, a number of years and no contributions, and read the year-by-year balance. Nothing you type leaves your browser. For the arithmetic around it, how compound interest actually works covers effective rates, fees and why growth arrives late, and markup versus margin is the same lesson about choosing the right base for a percentage.
Frequently asked questions
What is the CAGR formula?
CAGR = (ending value ÷ starting value)^(1 ÷ years) − 1. Divide the end by the start, raise the result to the power of one over the number of years, subtract 1 and read it as a percentage. For $10,000 growing to $20,000 over 6 years that gives 12.25% a year. It needs a starting value above zero and ignores everything between the two endpoints.
Is CAGR the same as the average annual return?
No. The average adds the yearly returns and divides by the number of years, while CAGR is the constant rate that actually produces the final balance. The average is never lower than the CAGR, and the gap grows with volatility. Returns of +50%, −40%, +30% and −20% average +5% a year, yet the money ends 6.4% lower, a CAGR of about −1.64% a year.
Can CAGR be negative?
Yes. If the ending value is lower than the starting value, the multiple is below 1 and the CAGR comes out negative. A balance that falls from $10,000 to $9,360 over four years has a CAGR of about −1.64% a year. It still needs a starting value above zero, and an ending value of zero gives −100% a year whatever the period, which says nothing about how fast it got there.
Does CAGR work if I keep adding money?
Not on its own. CAGR assumes a single starting amount with nothing added or withdrawn. Money you pay in later has had less time to grow, so dividing the final balance by the start flatters or misstates your return. For regular contributions use a money-weighted return, also called the internal rate of return, which weighs each deposit by how long it was invested.
Why can two investments have the same CAGR but not feel the same?
Because CAGR only uses the first and last value. One investment can climb steadily and another can fall 40% in year two and then recover, and both end at the same place with the same CAGR. A 40% drop needs a gain of about 67% to get back, so the second one was far harder to hold. CAGR tells you where you arrived, not how rough the road was.
Last updated October 3, 2026